The histogram displays the body fat percentages of 65 students taking a college health course.In addition to describing the distribution,give a reason to account for the shape of this distribution. 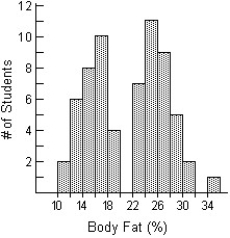
A) The distribution of body fat percentages is bimodal,with a cluster of body fat percentages around 16% and another cluster of body fat percentages around 26%.The upper cluster shows a bit of a skew to the right.Most students in the lower cluster have body fat percentages between 16% and 20%,and most students in the upper cluster have body fat percentages between 22% and 26%.Men and women have different body fat percentages: the lower cluster would likely represent male students,and the upper cluster would likely represent female students.
B) The distribution of body fat percentages is unimodal,with a bit of a skew to the right.The body fat percentages are centred around 20%,with a range of 10% to 35%.Most students have body fat percentages between 12% and 28%.Men and women have different body fat percentages,but the average of body fat percentages for men and women would be around 20%.
C) The distribution of body fat percentages is unimodal,with a bit of a skew to the right.The body fat percentages are centred around 24%,with a range of 10% to 34%.Most students have body fat percentages between 12% and 28%.Men and women have different body fat percentages,but the average of body fat percentages for men and women would be around 24%.
D) The distribution of body fat percentages is bimodal,with a cluster of body fat percentages around 16% and another cluster of body fat percentages around 26%.The upper cluster shows a bit of a skew to the right.Most students in the lower cluster have body fat percentages between 12% and 18%,and most students in the upper cluster have body fat percentages between 22% and 28%.Men and women have different body fat percentages: the lower cluster would likely represent male students,and the upper cluster would likely represent female students.
E) The distribution of body fat percentages is bimodal,with a cluster of body fat percentages around 12% and another cluster of body fat percentages around 28%.The upper cluster shows a bit of a skew to the right.Most students in the lower cluster have body fat percentages between 12% and 18%,and most students in the upper cluster have body fat percentages between 22% and 28%.Men and women have different body fat percentages: the lower cluster would likely represent male students,and the upper cluster would likely represent female students.
Correct Answer:
Verified
Q2: Heights of adult women attending a concert.
A)The
Q3: The number of days off that 30
Q4: Ontario wanted to find the typical size
Q5: The weights,in kilograms,of the members of the
Q6: The data below give the number of
Q7: The display shows the heights of Grade
Q8: Ages of high school students.
A)The distribution would
Q9: The histogram shows the lengths of hospital
Q10: A university instructor created a website for
Q11: The diastolic blood pressures,in mm Hg,for a
Unlock this Answer For Free Now!
View this answer and more for free by performing one of the following actions

Scan the QR code to install the App and get 2 free unlocks

Unlock quizzes for free by uploading documents