Multiple Choice
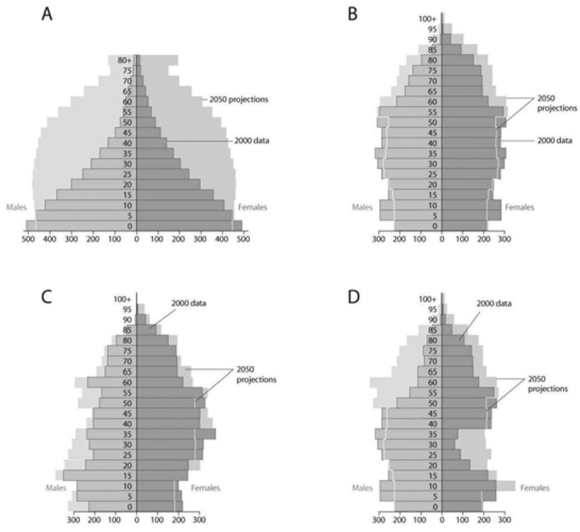 Based on the diagrams in the figure shown and on the large population of baby boomers in the United States, which graph best reflects U.S. population in 20 years?
A) A
B) B
C) C
D) D
Correct Answer:
Verified
Related Questions
Q47: Q48: What cannot be determined from examining age Q49: Use the following abstract from Theoretical Population Q50: It is estimated that a flock of Q51: Which statement is TRUE with regard to Q52: Q54: Often the growth cycle of one population Q55: The regular fluctuations in size of animal Q56: When the birth rate is equal to Q57: Unlock this Answer For Free Now! View this answer and more for free by performing one of the following actions Scan the QR code to install the App and get 2 free unlocks Unlock quizzes for free by uploading documents![]()
![]()
![]()

