Exhibit 9-A
The following diagram depicts monopolistically competitive firms. 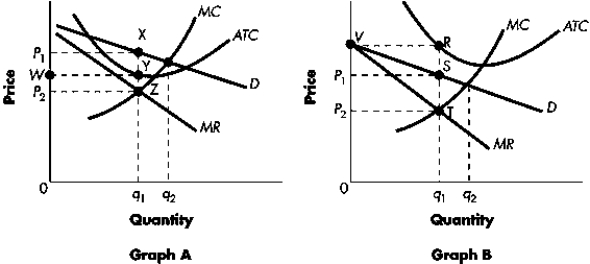
-Refer to Exhibit 9-A.In Graph A, the profit-maximizing (loss-minimizing) firm is making a ____, shown by the area ____.
A) loss; P1 X Y W
B) profit; P1 X Y W
C) loss; P2 Z Y W
D) profit; P2 Z Y W
Correct Answer:
Verified
Q171: Figure 9-A
The following diagram depicts firms in
Q172: Figure 9-C
The graph depicts a monopolistically competitive
Q173: Figure 9-C
The graph depicts a monopolistically competitive
Q174: Figure 9-C
The graph depicts a monopolistically competitive
Q175: Figure 9-A
The following diagram depicts firms in
Q177: Figure 9-C
The graph depicts a monopolistically competitive
Q178: Figure 9-A
The following diagram depicts firms in
Q179: Figure 9-E
Two cigarette manufacturers (Firm A and
Q180: Exhibit 9-A
The following diagram depicts monopolistically competitive
Q181: Figure 9-I
![]()
Unlock this Answer For Free Now!
View this answer and more for free by performing one of the following actions

Scan the QR code to install the App and get 2 free unlocks

Unlock quizzes for free by uploading documents