Figure 9-C
The graph depicts a monopolistically competitive firm's demand, marginal revenue, and cost curves. 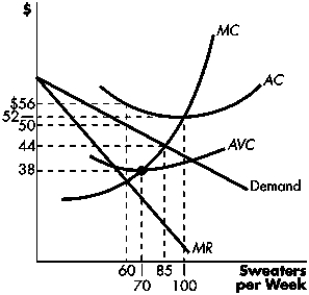
-Refer to Figure 9-D.The sentences of Suspect 1 and Suspect 2 under the Nash equilibrium of the prisoner's dilemma game are:
A) 2 years and 2 years, respectively.
B) 6 years and 6 years, respectively.
C) 10 years and 1 year, respectively.
D) 1 year and 10 years, respectively.
E) indeterminate.
Correct Answer:
Verified
Q172: Figure 9-C
The graph depicts a monopolistically competitive
Q173: Figure 9-C
The graph depicts a monopolistically competitive
Q174: Figure 9-C
The graph depicts a monopolistically competitive
Q175: Figure 9-A
The following diagram depicts firms in
Q176: Exhibit 9-A
The following diagram depicts monopolistically competitive
Q178: Figure 9-A
The following diagram depicts firms in
Q179: Figure 9-E
Two cigarette manufacturers (Firm A and
Q180: Exhibit 9-A
The following diagram depicts monopolistically competitive
Q181: Figure 9-I Q182: Figure 9-H
![]()
![]()
Unlock this Answer For Free Now!
View this answer and more for free by performing one of the following actions

Scan the QR code to install the App and get 2 free unlocks

Unlock quizzes for free by uploading documents