Figure 9-C
The graph depicts a monopolistically competitive firm's demand, marginal revenue, and cost curves. 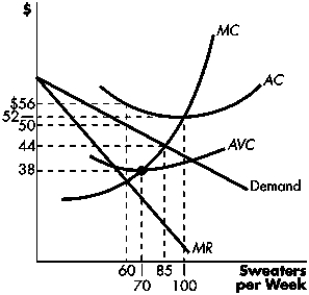
-Refer to Figure 9-D.The dominant strategy of Suspect 2 is to:
A) confess, regardless of what Suspect 1 is expected to do.
B) not confess, regardless of what Suspect 1 is expected to do.
C) confess if Suspect 1 is expected to confess, not confess if Suspect 1 is expected to not confess.
D) confess if Suspect 1 is expected to not confess, not confess if Suspect 1 is expected to confess.
Correct Answer:
Verified
Q169: Figure 9-A
The following diagram depicts firms in
Q170: Exhibit 9-A
The following diagram depicts monopolistically competitive
Q171: Figure 9-A
The following diagram depicts firms in
Q172: Figure 9-C
The graph depicts a monopolistically competitive
Q173: Figure 9-C
The graph depicts a monopolistically competitive
Q175: Figure 9-A
The following diagram depicts firms in
Q176: Exhibit 9-A
The following diagram depicts monopolistically competitive
Q177: Figure 9-C
The graph depicts a monopolistically competitive
Q178: Figure 9-A
The following diagram depicts firms in
Q179: Figure 9-E
Two cigarette manufacturers (Firm A and
Unlock this Answer For Free Now!
View this answer and more for free by performing one of the following actions

Scan the QR code to install the App and get 2 free unlocks

Unlock quizzes for free by uploading documents