Exhibit 9-A
The following diagram depicts monopolistically competitive firms. 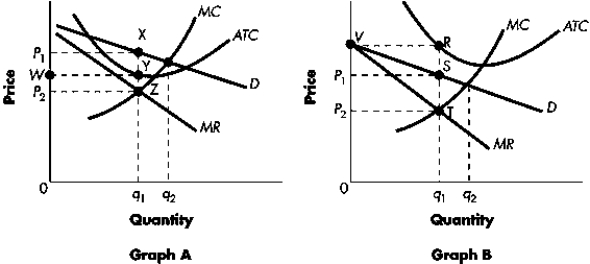
-Refer to Exhibit 9-A.In Graph B above, the firm will maximize profits (minimize losses) by producing at level of output ____ and charging price ____.
A) q1; P1
B) q2; P1
C) q1; P2
D) q2; P2
E) None of the above.
Correct Answer:
Verified
Q165: Figure 9-C
The graph depicts a monopolistically competitive
Q166: Exhibit 9-A
The following diagram depicts monopolistically competitive
Q167: Figure 9-C
The graph depicts a monopolistically competitive
Q168: Figure 9-B Q169: Figure 9-A Q171: Figure 9-A Q172: Figure 9-C Q173: Figure 9-C Q174: Figure 9-C Q175: Figure 9-A![]()
The following diagram depicts firms in
The following diagram depicts firms in
The graph depicts a monopolistically competitive
The graph depicts a monopolistically competitive
The graph depicts a monopolistically competitive
The following diagram depicts firms in
Unlock this Answer For Free Now!
View this answer and more for free by performing one of the following actions

Scan the QR code to install the App and get 2 free unlocks

Unlock quizzes for free by uploading documents