Figure 9-B 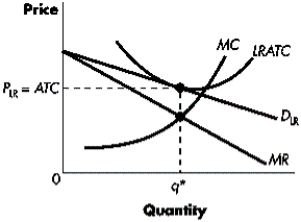
-Refer to Figure 9-B.The graph illustrates a firm in long-run equilibrium.Which of the following statements is true?
A) The firm is making a normal profit, output is q*; D = MC, and MR = LRATC at q*.
B) The firm is making a loss, output is q*; D = MC, and MR = LRATC.
C) The firm is making a normal profit, output is q*; D = LRATC, and MR = MC at q*.
D) The firm is making a loss, output is q*; D = LRATC, and MR = MC at q*.
E) The firm is making an above-normal profit, output is q*; D = LRATC, and MR = MC at q*.
Correct Answer:
Verified
Q163: Figure 9-E
Two cigarette manufacturers (Firm A and
Q164: Exhibit 9-A
The following diagram depicts monopolistically competitive
Q165: Figure 9-C
The graph depicts a monopolistically competitive
Q166: Exhibit 9-A
The following diagram depicts monopolistically competitive
Q167: Figure 9-C
The graph depicts a monopolistically competitive
Q169: Figure 9-A
The following diagram depicts firms in
Q170: Exhibit 9-A
The following diagram depicts monopolistically competitive
Q171: Figure 9-A
The following diagram depicts firms in
Q172: Figure 9-C
The graph depicts a monopolistically competitive
Q173: Figure 9-C
The graph depicts a monopolistically competitive
Unlock this Answer For Free Now!
View this answer and more for free by performing one of the following actions

Scan the QR code to install the App and get 2 free unlocks

Unlock quizzes for free by uploading documents