Exhibit 9-A
The following diagram depicts monopolistically competitive firms. 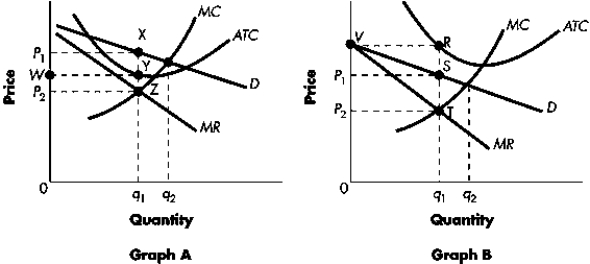
-Refer to Exhibit 9-A.In Graph B, the profit-maximizing (loss-minimizing) firm is making a ____ shown by the area ____.
A) profit; P1 V R S
B) loss; P2 P1 S T
C) profit; P2 P1 S T
D) loss; P1 V R S
Correct Answer:
Verified
Q161: Figure 9-E
Two cigarette manufacturers (Firm A and
Q162: Figure 9-A
The following diagram depicts firms in
Q163: Figure 9-E
Two cigarette manufacturers (Firm A and
Q164: Exhibit 9-A
The following diagram depicts monopolistically competitive
Q165: Figure 9-C
The graph depicts a monopolistically competitive
Q167: Figure 9-C
The graph depicts a monopolistically competitive
Unlock this Answer For Free Now!
View this answer and more for free by performing one of the following actions

Scan the QR code to install the App and get 2 free unlocks

Unlock quizzes for free by uploading documents