Multiple Choice
Exhibit 4-A 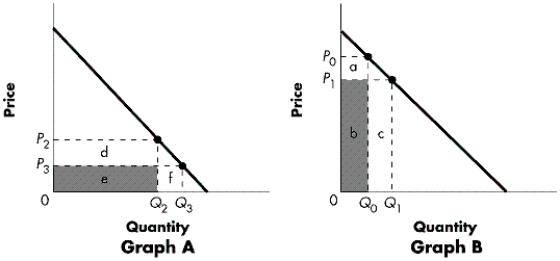
-Refer to Exhibit 4-A.Elasticity varies along a linear demand curve.Graph B represents the section of the curve where:
A) the curve is elastic.
B) Ed is > 1.
C) starting at P1, an increase in price will lead to a decrease in total revenue.
D) all of the above are correct.
E) none of the above are correct.
Correct Answer:
Verified
Related Questions
Q34: Gains from trade are measured by:
A)consumer surplus.
B)producer
Q168: Exhibit 4-A Q169: Exhibit 4-B Q170: Figure 4-A![]()
![]()
The diagram below represents the market

