Multiple Choice
Figure 4-A
The diagram below represents the market for butter. 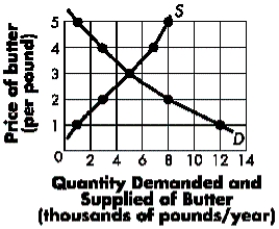
-Refer to Figure 4-A.If a price ceiling of $2 is imposed, ____ units of butter will be sold.
A) 8,000
B) 5,000
C) 4,000
D) 3,000
E) 2,000
Correct Answer:
Verified
Related Questions
Q173: Exhibit 4-A Q174: Exhibit 4-C Q175: Exhibit 4-A Q176: Exhibit 4-B Q177: The difference between the value of a Q179: Exhibit 4-C Q180: Based on the graph below, what is Q181: Table 4-E Q182: Figure 4-B Q183: Figure 4-C Unlock this Answer For Free Now! View this answer and more for free by performing one of the following actions Scan the QR code to install the App and get 2 free unlocks Unlock quizzes for free by uploading documents![]()
![]()
![]()
![]()
![]()
The schedule below shows the![]()
![]()

