Exhibit 4-A 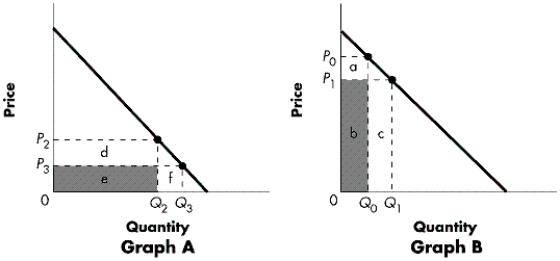
-Refer to Exhibit 4-A.Elasticity varies along a linear demand curve.Graph A represents the section of the curve where:
A) the curve is inelastic.
B) Ed is < 1.
C) starting at P2, a decrease in price will lead to a decrease in total revenue.
D) all of the above are correct.
E) none of the above are correct.
Correct Answer:
Verified
Q34: Gains from trade are measured by:
A)consumer surplus.
B)producer
Q170: Figure 4-A
The diagram below represents the market
Q172: Exhibit 4-C Q173: Exhibit 4-A Q174: Exhibit 4-C Q176: Exhibit 4-B Q177: The difference between the value of a Q178: Figure 4-A Q179: Exhibit 4-C Q180: Based on the graph below, what is Unlock this Answer For Free Now! View this answer and more for free by performing one of the following actions Scan the QR code to install the App and get 2 free unlocks Unlock quizzes for free by uploading documents![]()
![]()
![]()
![]()
The diagram below represents the market![]()

