Use the following to answer the question: 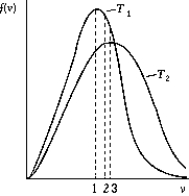
-The figure shows the distribution of the molecular speeds of a gas for two different temperatures.
A) The curve labeled T1 represents the distribution for the higher temperature molecules.
B) The point labeled "1" corresponds to the maximum speed of the molecules whose temperature is T1.
C) The point labeled "2" corresponds to the maximum speed of the molecules whose temperature is T1.
D) The point labeled "3" corresponds to the average speed of the molecules whose temperature is T1.
E) None of these is correct.
Correct Answer:
Verified
Q68: A room measures 3 m
Q69: If the rms speed of oxygen molecules
Q70: A 1 L container contains O2
Q71: Two cylinders are connected by a small
Q72: Use the following to answer the question:
Q73: On the basis of the kinetic theory
Q74: If the rms speed of nitrogen molecules
Q75: Use the following to answer the question:
Q76: A device used to measure the
Q78: In a Maxwell-Boltzmann distribution function of molecular
Unlock this Answer For Free Now!
View this answer and more for free by performing one of the following actions

Scan the QR code to install the App and get 2 free unlocks

Unlock quizzes for free by uploading documents