The accompanying chart shows the number of books written by each author in a collection of cookbooks.What type of data is being represented? 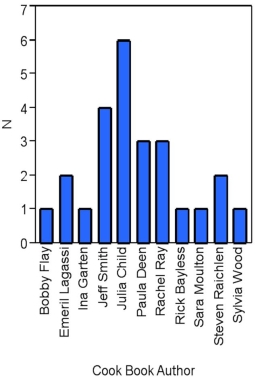
A) Quantitative,ordinal
B) Quantitative,ratio
C) Qualitative,nominal
D) Qualitative,ordinal
Correct Answer:
Verified
Q23: Exhibit 2-5.The following data represent scores on
Q24: Exhibit 2-6.The following data represent the recent
Q25: When constructing a frequency distribution for quantitative
Q26: Exhibit 2-4.Students in Professor Smith's Business Statistics
Q28: Exhibit 2-2.The following is a list of
Q29: Exhibit 2-5.The following data represent scores on
Q30: Exhibit 2-2.The following is a list of
Q31: Exhibit 2-3.A city in California spent six
Q32: The accompanying chart shows the numbers of
Q40: What graphical tool is best used to
Unlock this Answer For Free Now!
View this answer and more for free by performing one of the following actions

Scan the QR code to install the App and get 2 free unlocks

Unlock quizzes for free by uploading documents