Exhibit 2-5.The following data represent scores on a pop quiz in a statistics section: 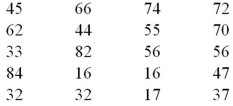 Refer to Exhibit 2-5.Suppose the data on quiz scores will be grouped into five classes.The width of the classes for a frequency distribution or histogram is closest to _____.
A) 10
B) 12
C) 14
D) 16
Correct Answer:
Verified
Q24: Exhibit 2-6.The following data represent the recent
Q25: When constructing a frequency distribution for quantitative
Q26: Exhibit 2-4.Students in Professor Smith's Business Statistics
Q27: The accompanying chart shows the number of
Q28: Exhibit 2-2.The following is a list of
Q30: Exhibit 2-2.The following is a list of
Q31: Exhibit 2-3.A city in California spent six
Q32: The accompanying chart shows the numbers of
Q33: Exhibit 2-5.The following data represent scores on
Q34: In the following pie chart representing a
Unlock this Answer For Free Now!
View this answer and more for free by performing one of the following actions

Scan the QR code to install the App and get 2 free unlocks

Unlock quizzes for free by uploading documents