The accompanying chart shows the numbers of books written by each author in a collection of cookbooks.What type of chart is this? 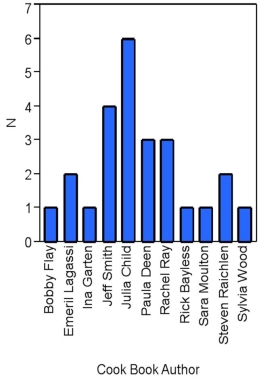
A) Bar chart for qualitative data
B) Bar chart for quantitative data
C) Frequency histogram for qualitative data
D) Frequency histogram for quantitative data
Correct Answer:
Verified
Q27: The accompanying chart shows the number of
Q27: Which of the following best describes a
Q28: Exhibit 2-2.The following is a list of
Q29: Exhibit 2-5.The following data represent scores on
Q30: Exhibit 2-2.The following is a list of
Q31: Exhibit 2-3.A city in California spent six
Q33: Exhibit 2-5.The following data represent scores on
Q34: In the following pie chart representing a
Q35: Exhibit 2-3.A city in California spent six
Q37: Exhibit 2-4.Students in Professor Smith's Business Statistics
Unlock this Answer For Free Now!
View this answer and more for free by performing one of the following actions

Scan the QR code to install the App and get 2 free unlocks

Unlock quizzes for free by uploading documents