Exhibit 2-5.The following data represent scores on a pop quiz in a statistics section: 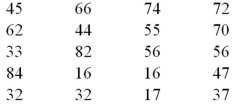 Refer to Exhibit 2-5.Suppose the data is grouped into 5 classes,and one of them will be "30 up to 44"-that is,{x;30 ≤ x < 44}.The frequency of this class is ____.
A) 0.20
B) 0.25
C) 4
D) 5
Correct Answer:
Verified
Q27: Which of the following best describes a
Q28: Exhibit 2-2.The following is a list of
Q29: Exhibit 2-5.The following data represent scores on
Q30: Exhibit 2-2.The following is a list of
Q31: Exhibit 2-3.A city in California spent six
Q32: The accompanying chart shows the numbers of
Q34: In the following pie chart representing a
Q35: Exhibit 2-3.A city in California spent six
Q37: Exhibit 2-4.Students in Professor Smith's Business Statistics
Q38: Exhibit 2-6.The following data represent the recent
Unlock this Answer For Free Now!
View this answer and more for free by performing one of the following actions

Scan the QR code to install the App and get 2 free unlocks

Unlock quizzes for free by uploading documents