Exhibit 2-6.The following data represent the recent sales price (in $1,000s) of 24 homes in a Midwestern city. 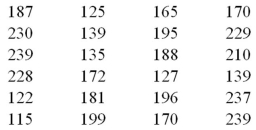 Refer to Exhibit 2-6.Suppose the data is grouped into five classes,and one of them will be "115 up to 140"- that is,{x;115 ≤ x < 140}.The relative frequency of this class is _____.
A) 6/24
B) 7/24
C) 6
D) 7
Correct Answer:
Verified
Q27: Which of the following best describes a
Q33: Exhibit 2-5.The following data represent scores on
Q34: In the following pie chart representing a
Q35: Exhibit 2-3.A city in California spent six
Q37: Exhibit 2-4.Students in Professor Smith's Business Statistics
Q39: Exhibit 2-4.Students in Professor Smith's Business Statistics
Q40: Exhibit 2-4.Students in Professor Smith's Business Statistics
Q41: Exhibit 2-7.Thirty students at Eastside High School
Q42: Exhibit 2-10.Automobiles traveling on a road with
Q43: Exhibit 2-8.Consider the following frequency distribution.
Unlock this Answer For Free Now!
View this answer and more for free by performing one of the following actions

Scan the QR code to install the App and get 2 free unlocks

Unlock quizzes for free by uploading documents