Exhibit 2-7.Thirty students at Eastside High School took the SAT on the same Saturday.Their raw scores are given next. 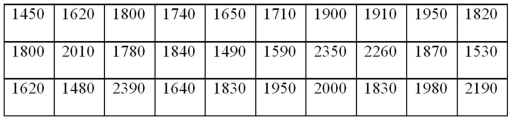 Refer to Exhibit 2-7.Consider a frequency distribution of the data that groups the data in classes of 1400 up to 1600,1600 up to 1800,1800 up to 2000,and so on.How many students scored at least 1800 but less than 2000?
A) 3
B) 7
C) 12
D) 18
Correct Answer:
Verified
Q27: Which of the following best describes a
Q37: Exhibit 2-4.Students in Professor Smith's Business Statistics
Q38: Exhibit 2-6.The following data represent the recent
Q39: Exhibit 2-4.Students in Professor Smith's Business Statistics
Q40: Exhibit 2-4.Students in Professor Smith's Business Statistics
Q42: Exhibit 2-10.Automobiles traveling on a road with
Q43: Exhibit 2-8.Consider the following frequency distribution.
Q44: Exhibit 2-10.Automobiles traveling on a road with
Q45: Exhibit 2-10.Automobiles traveling on a road with
Q46: Exhibit 2-9.An analyst constructed the following frequency
Unlock this Answer For Free Now!
View this answer and more for free by performing one of the following actions

Scan the QR code to install the App and get 2 free unlocks

Unlock quizzes for free by uploading documents