The following histogram represents the distribution of acceptance rates (percent accepted) among 25 business schools in 2004. In each class interval, the left endpoint but not the right is included, so the class intervals are 10 rate < 15, 15 rate < 20, etc. 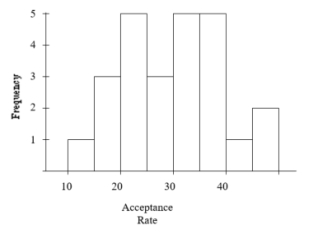 What is the approximate spread of the data?
A) 25
B) 30
C) 40
D) 50
Correct Answer:
Verified
Q3: The following is a histogram showing the
Q4: As part of a database of new
Q5: Employees at a large company are surveyed
Q6: Some of the variables from a survey
Q7: The following is a histogram showing the
Q9: The stemplot below displays midterm exam
Q10: A large university is divided into six
Q11: A sample of 40 employees from the
Q12: A poll was conducted of more than
Q13: A poll was conducted of more than
Unlock this Answer For Free Now!
View this answer and more for free by performing one of the following actions

Scan the QR code to install the App and get 2 free unlocks

Unlock quizzes for free by uploading documents