The following is a histogram showing the distribution per year of the cumulative property damage caused by tornadoes, over the period 1950 to 1999, in each of the 50 states and Puerto Rico. The data are in millions of dollars, and the class intervals are 0 to < 10, 10 to < 20, and so forth. 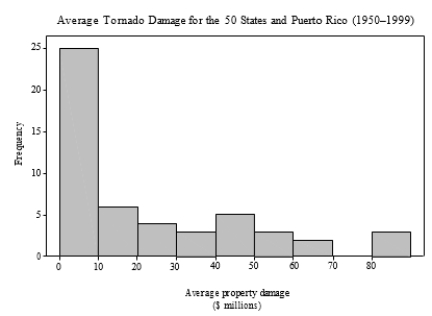 The percent of the data with average property damage of under $20 million dollars is about:
A) 20%.
B) 30%.
C) 40%.
D) 60%.
Correct Answer:
Verified
Q2: A company has three divisions and three
Q3: The following is a histogram showing the
Q4: As part of a database of new
Q5: Employees at a large company are surveyed
Q6: Some of the variables from a survey
Q8: The following histogram represents the distribution
Q9: The stemplot below displays midterm exam
Q10: A large university is divided into six
Q11: A sample of 40 employees from the
Q12: A poll was conducted of more than
Unlock this Answer For Free Now!
View this answer and more for free by performing one of the following actions

Scan the QR code to install the App and get 2 free unlocks

Unlock quizzes for free by uploading documents