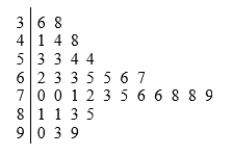
The stemplot below displays midterm exam scores for 34 students taking a calculus course. The highest possible test score was 100. The teacher declared that an exam grade of 65 or higher was good enough for a grade of C or better.  This stemplot is most similar to:
A) a boxplot of the data.
B) a time plot of the data with the observations taken in increasing order.
C) a histogram with class intervals 30 score < 40, 40 score < 50, etc.
D) reporting the five-number summary for the data, with the mean.
Correct Answer:
Verified
Q4: As part of a database of new
Q5: Employees at a large company are surveyed
Q6: Some of the variables from a survey
Q7: The following is a histogram showing the
Q8: The following histogram represents the distribution
Q10: A large university is divided into six
Q11: A sample of 40 employees from the
Q12: A poll was conducted of more than
Q13: A poll was conducted of more than
Q14: A description of different houses for sale
Unlock this Answer For Free Now!
View this answer and more for free by performing one of the following actions

Scan the QR code to install the App and get 2 free unlocks

Unlock quizzes for free by uploading documents