Figure 12-1
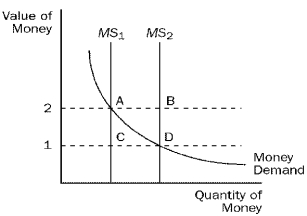
-Refer to Figure 12-1. If the money supply is MS2 and the value of money is 2, then there is an excess
A) demand for money that is represented by the distance between points A and C.
B) demand for money that is represented by the distance between points A and B.
C) supply of money that is represented by the distance between points A and C.
D) supply of money that is represented by the distance between points A and B.
Correct Answer:
Verified
Q57: A decrease in the money supply creates
Q81: Figure 12-1 Q81: Economic variables whose values are measured in Q82: Figure 12-2. On the graph, MS represents Q83: Figure 12-2. On the graph, MS represents Q84: Figure 12-3. On the graph, MS represents Q86: Figure 12-3. On the graph, MS represents Q88: Figure 12-3. On the graph, MS represents Q89: Figure 12-2. On the graph, MS represents Q90: Figure 12-1
![]()
![]()
Unlock this Answer For Free Now!
View this answer and more for free by performing one of the following actions

Scan the QR code to install the App and get 2 free unlocks

Unlock quizzes for free by uploading documents