Figure 12-1
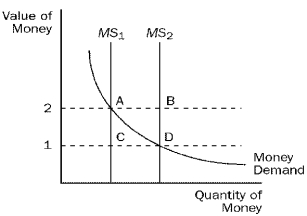
-Refer to Figure 12-1. When the money supply curve shifts from MS1 to MS2,
A) the equilibrium value of money decreases.
B) the equilibrium price level decreases.
C) the supply of money has decreased.
D) the demand for goods and services will decrease.
Correct Answer:
Verified
Q47: Open-market purchases by the Fed make the
Q57: A decrease in the money supply creates
Q67: When the money market is drawn with
Q72: Suppose there is a surplus in the
Q78: When the money market is drawn with
Q82: Figure 12-2. On the graph, MS represents
Q83: Figure 12-2. On the graph, MS represents
Q84: Figure 12-3. On the graph, MS represents
Q85: Figure 12-1 Q86: Figure 12-3. On the graph, MS represents
![]()
Unlock this Answer For Free Now!
View this answer and more for free by performing one of the following actions

Scan the QR code to install the App and get 2 free unlocks

Unlock quizzes for free by uploading documents