Figure 12-2. On the graph, MS represents the money supply and MD represents money demand. The usual quantities are measured along the axes.
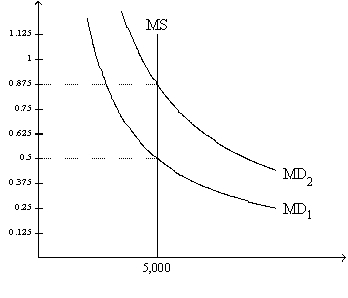
-Refer to Figure 12-2. If the relevant money-demand curve is the one labeled MD1, then
A) when the money market is in equilibrium, one dollar purchases one-half of a basket of goods and services.
B) when the money market is in equilibrium, one unit of goods and services sells for 2 dollars.
C) there is an excess demand for money if the value of money in terms of goods and services is 0.375.
D) All of the above are correct.
Correct Answer:
Verified
Q57: A decrease in the money supply creates
Q67: When the money market is drawn with
Q78: When the money market is drawn with
Q81: Figure 12-1 Q81: Economic variables whose values are measured in Q82: Figure 12-2. On the graph, MS represents Q84: Figure 12-3. On the graph, MS represents
![]()
Unlock this Answer For Free Now!
View this answer and more for free by performing one of the following actions

Scan the QR code to install the App and get 2 free unlocks

Unlock quizzes for free by uploading documents