The following figures represent distributions of gas molecules between two containers connected by an open tube. In which figure is the entropy of the system maximized?
A) 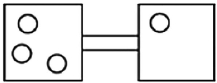
B) 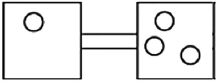
C) 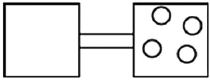
D) 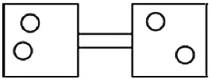
Correct Answer:
Verified
Q33: Which of the processes A-D will lead
Q34: Which of the following processes will lead
Q35: Before class, students were seated at three
Q36: Which of the following graphs best depicts
Q37: The gas above the liquid in
Q39: Which of the following must be
Q40: Indicate which of the following has
Q41: The standard molar entropy of magnesium fluoride
Q42: In an experiment, 1.00 atm of
Q43: NO gas is converted to NO2 gas
Unlock this Answer For Free Now!
View this answer and more for free by performing one of the following actions

Scan the QR code to install the App and get 2 free unlocks

Unlock quizzes for free by uploading documents