Which of the following graphs best depicts the entropy of a pure substance as the temperature is raised from its solid form through its liquid and gaseous forms?
A) 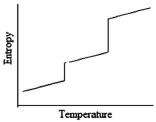
B) 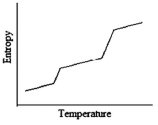
C) 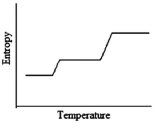
D) 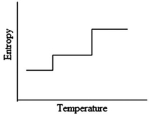
Correct Answer:
Verified
Q31: Which of the following will have
Q32: At 0 K, the entropy of a
Q33: Which of the processes A-D will lead
Q34: Which of the following processes will lead
Q35: Before class, students were seated at three
Q37: The gas above the liquid in
Q38: The following figures represent distributions of gas
Q39: Which of the following must be
Q40: Indicate which of the following has
Q41: The standard molar entropy of magnesium fluoride
Unlock this Answer For Free Now!
View this answer and more for free by performing one of the following actions

Scan the QR code to install the App and get 2 free unlocks

Unlock quizzes for free by uploading documents