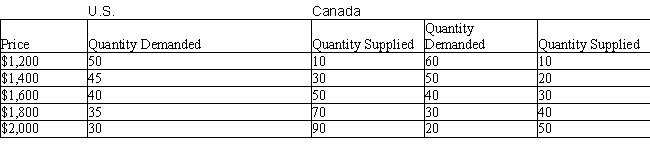
The table below shows the quantity demanded (in thousands) and quantity supplied (in thousands) of computers in the U.S. and Canada at different prices.Table 20.5
-Which of the following looks at the demand side of the market to explain some of the observed international trade patterns?
A) The theory of consumer preferences
B) The factor abundance theory
C) The product life cycle theory
D) The Ricardian model
E) The human skills approach
Correct Answer:
Verified
Q73: The figure given below shows the import
Q74: The table below shows the quantity demanded
Q75: The table below shows the quantity demanded
Q76: The table below shows the quantity demanded
Q77: The table below shows the quantity demanded
Q79: The table below shows the quantity demanded
Q80: The table below shows the quantity demanded
Q81: The table below shows the quantity demanded
Q82: The table below shows the quantity demanded
Q83: The table below shows the quantity demanded
Unlock this Answer For Free Now!
View this answer and more for free by performing one of the following actions

Scan the QR code to install the App and get 2 free unlocks

Unlock quizzes for free by uploading documents