The following figures show the demand and supply of labor in two different types of labor market. Figure 29.5 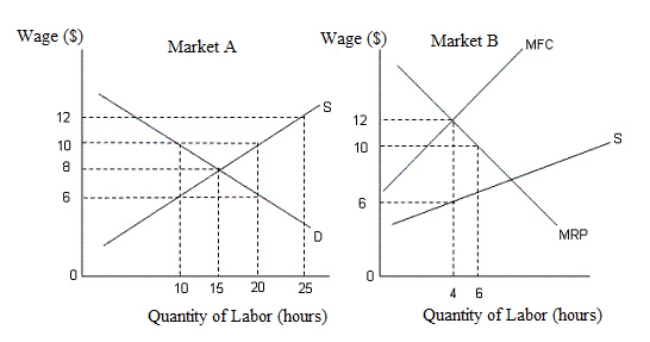 In the figures,
D: Demand curve for labor
S: Supply curve of labor
MRP: Marginal revenue product
MFC: Marginal factor cost
Refer to Figure 29.5.If a minimum wage of $10 is set by the government, then in market A:
A) a shortage of 20 labor hours is created.
B) the quantity demanded for labor rises to 20 labor hours.
C) a shortage of 15 labor hours is created.
D) a surplus of 20 labor hours is created.
E) a surplus of 10 labor hours is created.
Correct Answer:
Verified
Q43: The figure given below shows the income-leisure
Q50: The figure given below shows the income-leisure
Q51: The figure given below shows the income-leisure
Q53: The burden of a tax is mainly
Q53: The figure given below shows the income-leisure
Q54: The figure given below shows the income-leisure
Q56: The figure given below shows the demand
Q60: The figure given below shows the demand
Q75: Which of the following is an instance
Q79: Which of the following is not a
Unlock this Answer For Free Now!
View this answer and more for free by performing one of the following actions

Scan the QR code to install the App and get 2 free unlocks

Unlock quizzes for free by uploading documents