The figure given below shows the revenue and cost curves of a perfectly competitive firm. Figure 9.2 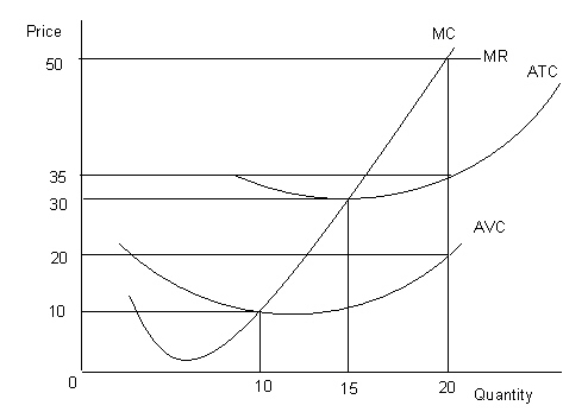 MC: Marginal cost curve
MR: Marginal revenue curve
ATC: Average-total-cost curve
AVC: Average-variable-cost curve
Refer to Figure 9.2.If the marginal-revenue curve would have intersected the average-total-cost curve at its lowest point and the firm maximized profit, then total revenue would have been equal to:
A) $500.
B) $550.
C) $600.
D) $450.
E) $400.
Correct Answer:
Verified
Q45: The figure given below shows the revenue
Q46: The figure given below shows the revenue
Q46: The figure given below shows the revenue
Q47: The figure given below shows the revenue
Q48: The figure given below shows the revenue
Q48: The figure given below shows the revenue
Q49: The figure given below shows the revenue
Q50: If the marginal cost exceeds the marginal
Q51: The figure given below shows the revenue
Q54: The figure given below shows the revenue
Unlock this Answer For Free Now!
View this answer and more for free by performing one of the following actions

Scan the QR code to install the App and get 2 free unlocks

Unlock quizzes for free by uploading documents