The figure given below shows the revenue and the cost curves of a perfectly competitive firm. Figure 9.3 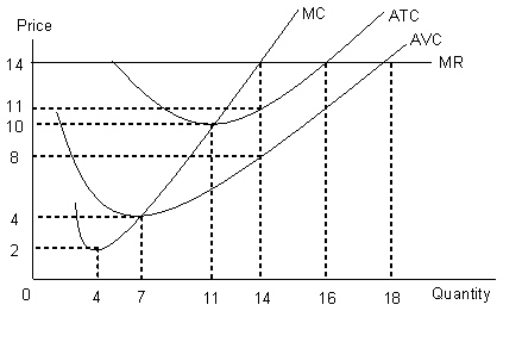 In Figure 9.3, at equilibrium, the firm enjoys a profit of:
A) $69.
B) $42.
C) $60.
D) $27.
E) $48.
Correct Answer:
Verified
Q45: The figure given below shows the revenue
Q46: The figure given below shows the revenue
Q48: The figure given below shows the revenue
Q50: The figure given below shows the revenue
Q51: The figure given below shows the revenue
Q54: The figure given below shows the revenue
Q57: The figure given below shows the revenue
Q58: The figure given below shows the revenue
Q60: The figure given below shows the revenue
Q70: The figure given below shows the demand
Unlock this Answer For Free Now!
View this answer and more for free by performing one of the following actions

Scan the QR code to install the App and get 2 free unlocks

Unlock quizzes for free by uploading documents