This graph shows one estimate of average air temperatures.This graph indicates that: 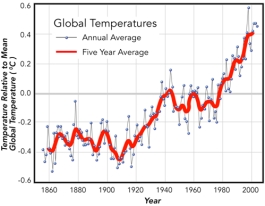
A) humans and greenhouse gases are responsible for global warming
B) overall,air temperatures have been increasing since around 1910
C) Earth was cooler in the last part of the 1800s than it was in the first half of the 1900s
D) all of these
Correct Answer:
Verified
Q59: These pillars are remnants of layers,most of
Q60: The subtropics at 30
Q61: Which of the following landscape features is
Q62: This graph shows an interpretation of temperatures
Q63: These data,derived from ice cores,indicate that:
Q65: This plot of ice-core data shows measurements
Q67: Which of the following is true
Q69: This graph shows an interpretation of temperatures
Q92: Based on data collected in Hawaii, since
Q104: Which of the following is a way
Unlock this Answer For Free Now!
View this answer and more for free by performing one of the following actions

Scan the QR code to install the App and get 2 free unlocks

Unlock quizzes for free by uploading documents