This plot of ice-core data shows measurements of CO2 content and interpretation of temperatures.These data show: 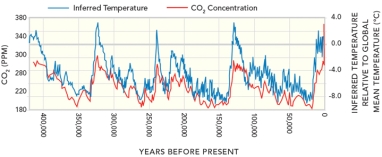
A) that CO2 concentration and temperature generally increase and decrease over the same time periods
B) that most temperature changes on this graph are due to CO2 introduced by humans
C) that current temperatures are the highest they have been
D) all of these
Correct Answer:
Verified
Q60: The subtropics at 30
Q61: Which of the following landscape features is
Q62: This graph shows an interpretation of temperatures
Q63: These data,derived from ice cores,indicate that:
Q64: This graph shows one estimate of average
Q67: Which of the following is true
Q69: This graph shows an interpretation of temperatures
Q92: Based on data collected in Hawaii, since
Q98: Which of the following is NOT true
Q104: Which of the following is a way
Unlock this Answer For Free Now!
View this answer and more for free by performing one of the following actions

Scan the QR code to install the App and get 2 free unlocks

Unlock quizzes for free by uploading documents