This graph shows an interpretation of temperatures based on the lengths of glaciers.This graph indicates that: 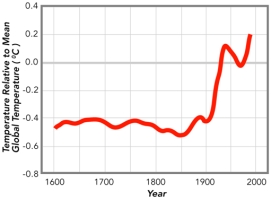
A) climate has been changing over the past hundred years
B) overall,air temperatures have been increasing since around 1900
C) from 1600 to 1900 the Earth was dramatically colder than it has been since 1900
D) all of these
Correct Answer:
Verified
Q57: This photograph shows an accumulation of calcium
Q59: These pillars are remnants of layers,most of
Q60: The subtropics at 30
Q61: Which of the following landscape features is
Q63: These data,derived from ice cores,indicate that:
Q64: This graph shows one estimate of average
Q65: This plot of ice-core data shows measurements
Q66: Wind moves sediment by:
A) bouncing sand grains
Q67: Which of the following is true
Q104: Which of the following is a way
Unlock this Answer For Free Now!
View this answer and more for free by performing one of the following actions

Scan the QR code to install the App and get 2 free unlocks

Unlock quizzes for free by uploading documents