The table below displays the quarterly revenue of Wallace Printing for this year, arranged by quarter. The numbers are all in thousands of dollars. Use Figure 24-5a and Figure 24-5b to construct a bar graph and a line graph for the data. Label where necessary.
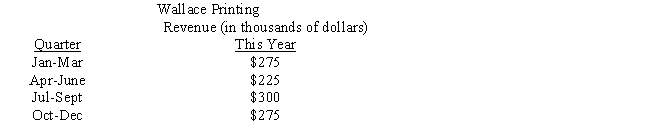
a.Bar graph
b.Line graph
Correct Answer:
Verified
Q18: Construct a frequency distribution for the set
Q19: Compute the mean, median, and mode of
Q20: Mean:
_
b.Median:
_
c.Mode:
_
Q21: Last year, David Lum opened a new
Q22: In June, Karen Henderson, an accountant, examined
Q24: David Lum operates two pharmacies, one near
Q25: The table below displays the quarterly revenues
Q26: David Lum operates two pharmacies, one near
Q27: Use Figure 24-3 to construct a histogram
Q28: Enrico Vaselli owns Enrico's European Shoe Store,
Unlock this Answer For Free Now!
View this answer and more for free by performing one of the following actions

Scan the QR code to install the App and get 2 free unlocks

Unlock quizzes for free by uploading documents