Last year, David Lum opened a new pharmacy. He already had one store located near the city hospital. When a new outpatient surgery clinic began operation, he opened his second pharmacy nearby. In June of this year, Lum wanted a business loan. The bank asked him to report the monthly revenues of each store for the first five months of the year. Lum displayed the data as follows.
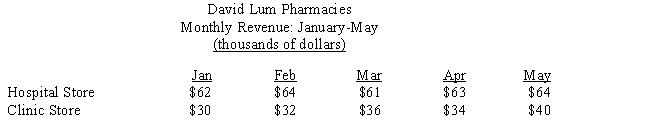
a.Bar graph
a.Use Figure 24-7a to construct a bar graph to illustrate the monthly revenues of the clinic store. Label where necessary.b
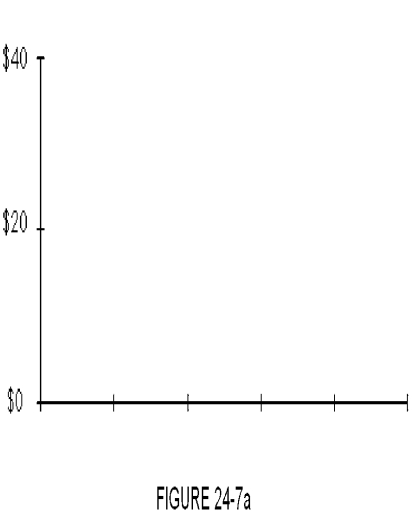
Use Figure 24-7b to construct a line graph to illustrate the monthly revenues of the clinic store. Label where necessary.
b.Line graph
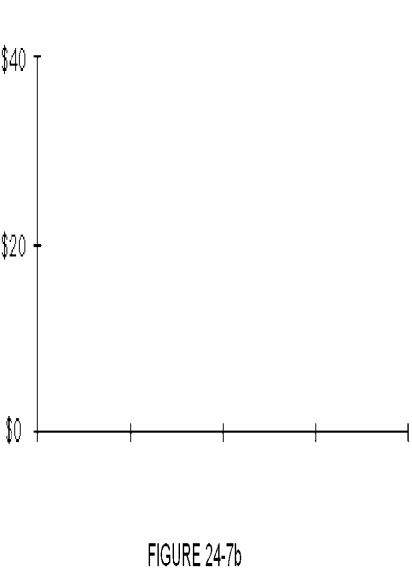
c.Comparative bar graph
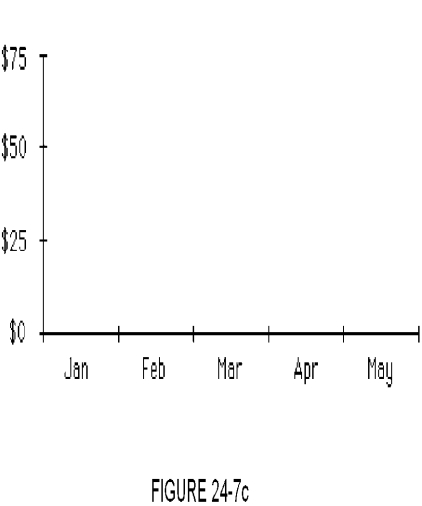
c.Use Figure 24-7c to construct a comparative bar graph to illustrate the monthly revenues of both pharmacies. Label where necessary. Shade the bars for each store differently.
Correct Answer:
Verified
Q16: Construct a frequency distribution for the set
Q17: Construct a frequency distribution for the set
Q18: Construct a frequency distribution for the set
Q19: Compute the mean, median, and mode of
Q20: Mean:
_
b.Median:
_
c.Mode:
_
Q22: In June, Karen Henderson, an accountant, examined
Q23: The table below displays the quarterly revenue
Q24: David Lum operates two pharmacies, one near
Q25: The table below displays the quarterly revenues
Q26: David Lum operates two pharmacies, one near
Unlock this Answer For Free Now!
View this answer and more for free by performing one of the following actions

Scan the QR code to install the App and get 2 free unlocks

Unlock quizzes for free by uploading documents