Consider the following graph. 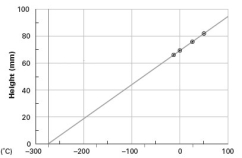 This graph is an illustration of which of the following laws?
A) Charles's law
B) Boyle's law
C) combined gas law
D) law of conservation of mass
E) law of conservation of energy
Correct Answer:
Verified
Q7: Which of the following statements are true?
i.One
Q18: Consider the mercury barometer shown below.
Q19: Convert 13.3 psi to kPa and torr.
A)1.35
Q21: Consider the following graph.The data for
Q24: The pressure on 474 mL of a
Q25: A gas sample was originally in a
Q27: A gas has a volume of 3.77
Q28: The pressure of a gas is 817
Q30: A container holds 34.3 m3 of gas
Q53: A gas sample occupies 8.15 volume units
Unlock this Answer For Free Now!
View this answer and more for free by performing one of the following actions

Scan the QR code to install the App and get 2 free unlocks

Unlock quizzes for free by uploading documents