Consider the following graph.The data for the graph was obtained at constant temperature. 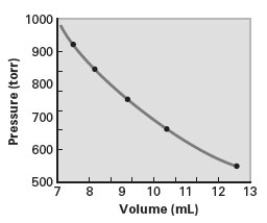 Which of the following correctly describes the relationship shown on the graph?
(i) V P
(ii) V 1/P
(iii) V = kP
(iv) V = k(1/P)
A) iv only
B) i and ii
C) iii and iv
D) i and iii
E) ii and iv
Correct Answer:
Verified
Q7: Which of the following statements are true?
i.One
Q13: Which of the following statements is false?
A)Gas
Q17: Consider the following weather map showing the
Q18: Consider the mercury barometer shown below.
Q19: Convert 13.3 psi to kPa and torr.
A)1.35
Unlock this Answer For Free Now!
View this answer and more for free by performing one of the following actions

Scan the QR code to install the App and get 2 free unlocks

Unlock quizzes for free by uploading documents