The following frequency distribution shows the frequency of the asking price,in thousands of dollars,for current homes on the market in a particular city. 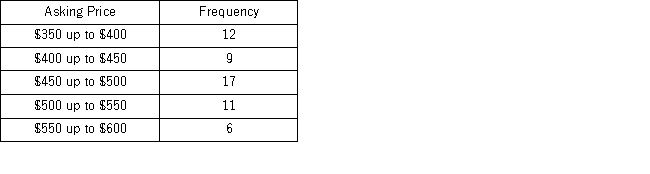 What percentage of houses has an asking price under $550,000?
A) 50.5%
B) 69.1%
C) 89.1%
D) 95.0%
Correct Answer:
Verified
Q81: Use the following data to construct a
Q81: Graphically, we can show a(n) _ _
Q82: The statistics professor has kept attendance records
Q83: The following frequency distribution shows the frequency
Q84: What type of relationship is indicated in
Q85: Use the following data to construct a
Q87: Consider the following stem-and-leaf diagram. 
Q88: The Statistical Abstract of the United States,2010
Q89: The following table shows the percentage of
Q91: The following stem-and-leaf diagram shows the last
Unlock this Answer For Free Now!
View this answer and more for free by performing one of the following actions

Scan the QR code to install the App and get 2 free unlocks

Unlock quizzes for free by uploading documents