Consider the following stem-and-leaf diagram. 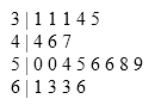 Which of the following statements is correct?
A) There are a total of 10 data values in this data set.
B) The data value that occurs most often is 50.
C) This largest data value is 59.
D) The range 50-59 contains the most values.
Correct Answer:
Verified
Q81: Graphically, we can show a(n) _ _
Q82: The statistics professor has kept attendance records
Q83: The following frequency distribution shows the frequency
Q84: What type of relationship is indicated in
Q85: Use the following data to construct a
Q86: The following frequency distribution shows the frequency
Q88: The Statistical Abstract of the United States,2010
Q89: The following table shows the percentage of
Q91: The following stem-and-leaf diagram shows the last
Q92: What type of relationship is indicated in
Unlock this Answer For Free Now!
View this answer and more for free by performing one of the following actions

Scan the QR code to install the App and get 2 free unlocks

Unlock quizzes for free by uploading documents