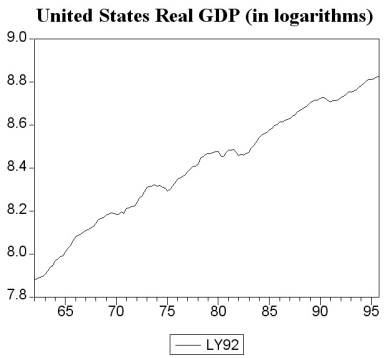
The following two graphs give you a plot of the United States aggregate unemployment rate for the sample period 1962:I to 1999:IV,and the (log)level of real United States GDP for the sample period 1962:I to 1995:IV.You want test for stationarity in both cases.Indicate whether or not you should include a time trend in your Augmented Dickey-Fuller test and why. 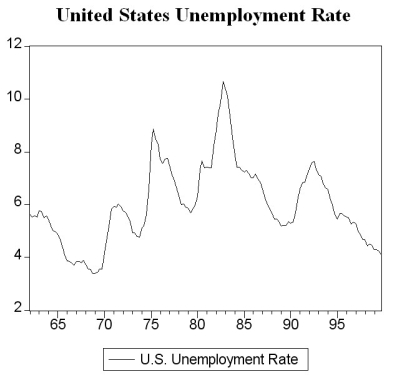
Correct Answer:
Verified
View Answer
Unlock this answer now
Get Access to more Verified Answers free of charge
Q32: The BIC is a statistic
A)commonly used to
Q41: You have collected data for real GDP
Q43: Find data for real GDP (Yt)for the
Q44: (Requires Appendix material): Show that the AR(1)process
Q45: Consider the AR(1)model Yt = β0 +
Q46: Consider the following model
Yt = α0 +
Q46: You want to determine whether or not
Q48: (Requires Appendix material)The long-run,stationary state solution of
Q49: You have decided to use the Dickey
Q50: Consider the standard AR(1)Yt = β0 +
Unlock this Answer For Free Now!
View this answer and more for free by performing one of the following actions

Scan the QR code to install the App and get 2 free unlocks

Unlock quizzes for free by uploading documents