The scatterplot below displays data collected from 20 adults on their age and overall GPA at graduation. 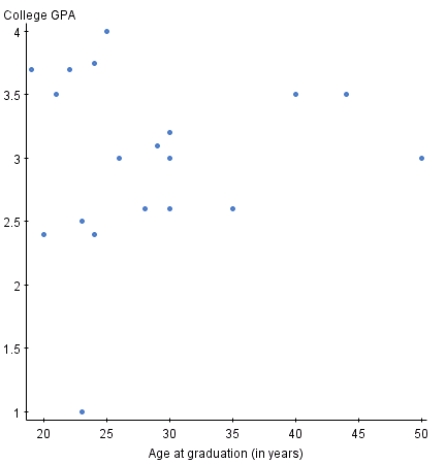
There appear to be outliers in the data set.
Correct Answer:
Verified
Q6: The graph below is a plot of
Q7: A researcher measured the height (in feet)and
Q8: The scatterplot below displays data collected from
Q9: A variable that explains or causes change
Q10: The scatterplot below displays data collected from
Q12: Volunteers for a research study were divided
Q13: Two variables are _ if knowing the
Q14: Fill in the blank.When creating a scatterplot,one
Q15: Fill in the blank.The owner of a
Q16: Fill in the blank.The Environmental Protection Agency
Unlock this Answer For Free Now!
View this answer and more for free by performing one of the following actions

Scan the QR code to install the App and get 2 free unlocks

Unlock quizzes for free by uploading documents