The timeplot below gives the number of burglaries committed each month for a city in Ohio.The plot is for the three-year period of January 1987 to December 1989. 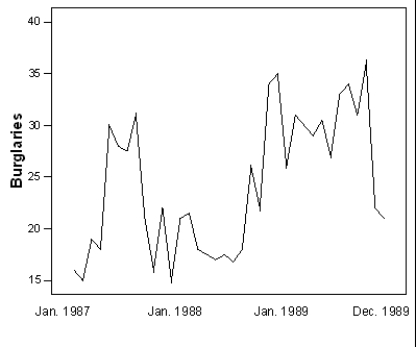 What is approximately the maximum number of burglaries for a month in 1988?
A) 20
B) 25
C) 30
D) 35
Correct Answer:
Verified
Q68: When examining a distribution of a quantitative
Q69: The World Malaria Report (2008)has information on
Q70: The World Malaria Report (2008)has information on
Q71: Which of the following statements are FALSE?
A)The
Q72: Statistics were gathered on the number of
Q74: The World Malaria Report (2008)has information on
Q75: In the fuel efficiency study of 2007
Q76: The World Malaria Report (2008)has information on
Q77: The following stemplot displays the number of
Q78: Malaria is a leading cause of infectious
Unlock this Answer For Free Now!
View this answer and more for free by performing one of the following actions

Scan the QR code to install the App and get 2 free unlocks

Unlock quizzes for free by uploading documents