Statistics were gathered on the number of homicides committed with guns in Australia in the years from 1980 to 2004.From these data the following graph was constructed. 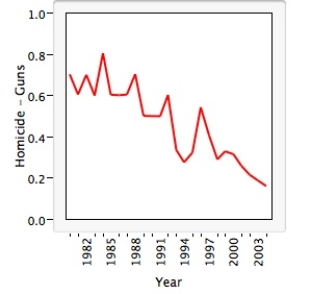 This plot is a graph of a(n) _____________,and it shows that there is/are ___________ in the data.
A) categorical variable;skewness to the right
B) histogram;multiple peaks
C) line;an increasing trend
D) quantitative variable;outlier values
E) time series;a decreasing trend
Correct Answer:
Verified
Q67: A study of 2007 model automobiles was
Q68: When examining a distribution of a quantitative
Q69: The World Malaria Report (2008)has information on
Q70: The World Malaria Report (2008)has information on
Q71: Which of the following statements are FALSE?
A)The
Q73: The timeplot below gives the number of
Q74: The World Malaria Report (2008)has information on
Q75: In the fuel efficiency study of 2007
Q76: The World Malaria Report (2008)has information on
Q77: The following stemplot displays the number of
Unlock this Answer For Free Now!
View this answer and more for free by performing one of the following actions

Scan the QR code to install the App and get 2 free unlocks

Unlock quizzes for free by uploading documents