The following stemplot displays the number of forest fires (in thousands) that occurred each year over the period from 1970 to 2000 in Canada,where 5|2 represents 5200 fires. 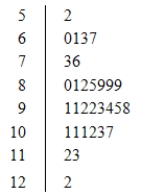 From the stemplot we can see that
A) the shape of the distribution is skewed to the left.
B) there appears to be one large peak.
C) there was a total of 9 years in which more than 10,000 fires occurred.
D) only one year had fewer than 6000 fires.
E) All of the above
Correct Answer:
Verified
Q72: Statistics were gathered on the number of
Q73: The timeplot below gives the number of
Q74: The World Malaria Report (2008)has information on
Q75: In the fuel efficiency study of 2007
Q76: The World Malaria Report (2008)has information on
Q78: Malaria is a leading cause of infectious
Q79: According to the American Cancer Society,the decline
Q80: Malaria is a leading cause of infectious
Q81: As part of a large ongoing study
Q82: The bar graph below represents the highest
Unlock this Answer For Free Now!
View this answer and more for free by performing one of the following actions

Scan the QR code to install the App and get 2 free unlocks

Unlock quizzes for free by uploading documents