The double-broken-line graph shows the number of Calories per day that should be consumed by women and men in various age groups. Use the following graph. What is the difference between the number of Calories recommended for men and the number recommended for women 11 to 14 years of age? 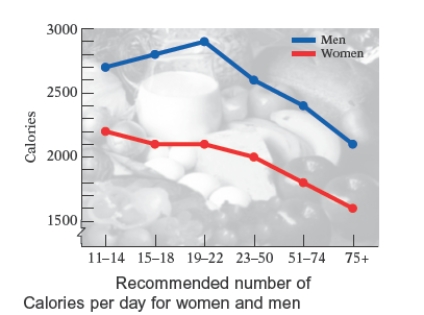
A) 600 Calories
B) 500 Calories
C) 400 Calories
D) 700 Calories
E) 300 Calories
Correct Answer:
Verified
Q20: The circle graph shows a breakdown, according
Q21: The broken-line graph below shows the average
Q22: The double-bar graph below shows the fuel
Q23: The bar graph below shows the
Q24: The bar graph below shows the regions
Q26: The double-bar graph below shows the fuel
Q27: A nurse monitors the blood glucose levels
Q28: A nurse monitors the blood glucose levels
Q29: The broken-line graph shows the percent
Q30: The double-broken-line graph below shows the number
Unlock this Answer For Free Now!
View this answer and more for free by performing one of the following actions

Scan the QR code to install the App and get 2 free unlocks

Unlock quizzes for free by uploading documents