The circle graph shows a breakdown, according to age, of the homeless in America. On average, how many of every 100,000 homeless people in America are over the age of 35? 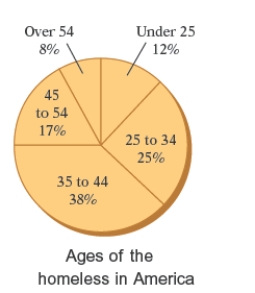
A) 62000 people
B) 63000 people
C) 64000 people
D) 65000 people
E) 61000 people
Correct Answer:
Verified
Q15: The circle graph shows the number
Q16: The circle graph shows the number of
Q17: The pictograph below shows the approximate
Q18: The circle graph shows the number
Q19: The pictograph in the following figure gives
Q21: The broken-line graph below shows the average
Q22: The double-bar graph below shows the fuel
Q23: The bar graph below shows the
Q24: The bar graph below shows the regions
Q25: The double-broken-line graph shows the number of
Unlock this Answer For Free Now!
View this answer and more for free by performing one of the following actions

Scan the QR code to install the App and get 2 free unlocks

Unlock quizzes for free by uploading documents