The pictograph in the following figure gives typical hourly rates for these health care providers. Use the graph and find the ratio of the hourly rate for a Certified Dental Assistant to the hourly rate for a Certified Nurse Assistant. 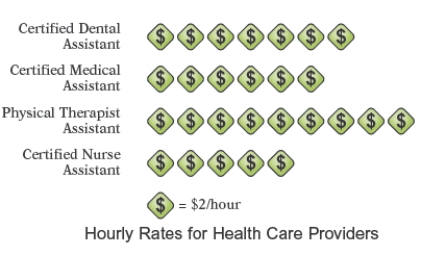
A) 7 to 5
B) 6 to 5
C) 7 to 9
D) 5 to 6
E) 5 to 3
Correct Answer:
Verified
Q14: The circle graph shows the number
Q15: The circle graph shows the number
Q16: The circle graph shows the number of
Q17: The pictograph below shows the approximate
Q18: The circle graph shows the number
Q20: The circle graph shows a breakdown, according
Q21: The broken-line graph below shows the average
Q22: The double-bar graph below shows the fuel
Q23: The bar graph below shows the
Q24: The bar graph below shows the regions
Unlock this Answer For Free Now!
View this answer and more for free by performing one of the following actions

Scan the QR code to install the App and get 2 free unlocks

Unlock quizzes for free by uploading documents