The broken-line graph below shows the average monthly snowfall during ski season around Aspen, Colorado. During which month is the snowfall the least? 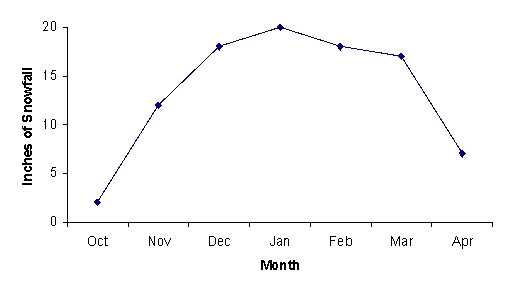
A) April
B) January
C) November
D) October
E) March
Correct Answer:
Verified
Q16: The circle graph shows the number of
Q17: The pictograph below shows the approximate
Q18: The circle graph shows the number
Q19: The pictograph in the following figure gives
Q20: The circle graph shows a breakdown, according
Q22: The double-bar graph below shows the fuel
Q23: The bar graph below shows the
Q24: The bar graph below shows the regions
Q25: The double-broken-line graph shows the number of
Q26: The double-bar graph below shows the fuel
Unlock this Answer For Free Now!
View this answer and more for free by performing one of the following actions

Scan the QR code to install the App and get 2 free unlocks

Unlock quizzes for free by uploading documents