The diagram below shows the marginal costs of pollution abatement for two firms,Firm 1 and Firm 2.
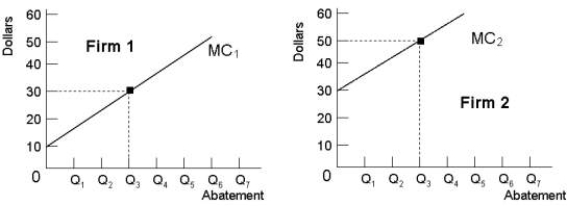 FIGURE 17- 5
-Refer to Figure 17- 5.Suppose Firm 1 and Firm 2 are each abating Q3 units of pollution.If the government imposed an emissions tax of $40 per unit of emissions,
A) Firm 2 would increase abatement beyond Q3 and Firm 1 would abate less than Q3.
B) each firm would abate to the same level.
C) Firm 1 would increase abatement beyond Q3 and Firm 2 would abate less than Q3.
D) each firm would abate to Q3.
E) the level of pollution would be optimal.
Correct Answer:
Verified
Q20: The figure below shows the marginal benefit
Q24: If residential garbage collection were financed by
Q25: Suppose a firm producing roof shingles imposes
Q26: The diagram below shows the marginal costs
Q27: The diagram below shows the marginal cost
Q28: The optimal amount of pollution abatement is
Q30: Between 1990 and 2009,Canada's greenhouse gas emissions
Q31: The figure below shows the demand and
Q32: The diagram below shows the private and
Q33: Economists generally view pollution as
A)a negative economy.
B)a
Unlock this Answer For Free Now!
View this answer and more for free by performing one of the following actions

Scan the QR code to install the App and get 2 free unlocks

Unlock quizzes for free by uploading documents