The diagram below shows a market for tradable pollution permits. 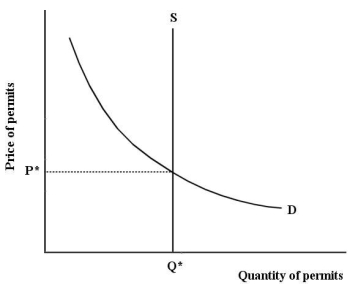 FIGURE 17-8
-Refer to Figure 17-8,which depicts the market for tradable pollution permits.If the environmental organization called "Friends of the Earth" buys a large quantity of pollution permits and permanently decides not to use them,then
A) the demand curve shifts to the left,and the equilibrium price falls.
B) the supply curve shifts to the right,and the equilibrium price falls.
C) the supply curve shifts to the left,and the equilibrium price rises.
D) allocative efficiency is lost.
E) there is no impact on the equilibrium.
Correct Answer:
Verified
Q99: If residential garbage collection were financed by
Q100: Direct pollution controls are usually inefficient because
Q101: Consider a coal-fired electric-power plant that is
Q102: The diagram below shows the marginal cost
Q103: A paper mill discharges chemicals into a
Q105: The diagram below shows the marginal cost
Q106: As a method of pollution control,tradable emissions
Q107: The diagram below shows a market for
Q108: If emissions permits are traded freely between
Q109: The diagram below shows the marginal cost
Unlock this Answer For Free Now!
View this answer and more for free by performing one of the following actions

Scan the QR code to install the App and get 2 free unlocks

Unlock quizzes for free by uploading documents